Execution Plans

Compiles and recompiles

I want to spend some time over the next few months looking at query compilation and the plan cache, and there’s a couple concepts that I want to get cleared up beforehand. The first of those is around two terms that are often used interchangeably, compile and recompile.

Compile

A compile occurs when a query is given to the query optimiser and, when it does a lookup into the plan cache, no matching plan is found. The optimism must then compile the query, generating an execution plan, must add that plan to the plan cache (in most cases) and then must pass that plan onto the query execution engine so that the query can be executed. (http://technet.microsoft.com/en-us/library/Cc966425)

Recompile

A recompile is something slightly different. For a recompile, the optimiser must find a matching plan when it queries the plan cache, must hand that cached plan over to the query execution engine and then while doing validation checks the execution engine must determine that then query plan is no longer valid and request the optimiser to partially or completely recompile the query. (http://technet.microsoft.com/en-us/library/Cc966425)

Subtle difference. Both cases result in the optimiser generating an execution plan, but the reasons can be different. Also worth noting is that a compile results in a new plan in the cache, a recompile simply replaces an existing plan.

Another difference since SQL 2005 – a compile is for the entire batch, but a recompile can be for just a single statement within the batch.


Now the theory’s dealt with, let’s look at some examples and see how we can track these two events and try and get a better understanding of which occurs when and how they look.

The tools I’m going to use to track these are performance monitor with the compiles/sec and recompiles/sec counters and SQL Profiler with the event SP:StmtRecompile event (there’s no profiler event for compilation). I’ll also check what’s in the plan cache after each test.

The first one’s going to be very simplistic, a query run against an empty plan cache.

DBCC FREEPROCCACHE
GO

EXEC dbo.OutStandingTotalByStatus
GO

What we get from that is a non-zero value for SQL Compilations/sec (perfmon) and the following from profiler (The SQL Recompiles/sec remains 0)

Compiles1

and the plan cache now contains one plan with one use. (for more info on how the CacheMiss and CacheInsert events work, see https://www.sqlinthewild.co.za/index.php/2010/07/27/hit-and-miss/ and https://www.sqlinthewild.co.za/index.php/2010/08/31/come-and-gone/)

Compiles2

In this case, I hope it was clear, we had a compile occur (empty plan cache before, new plan added to cache).

Now what happens if, with no clearing of the cache nor anything else being done, I mark that procedure for recompile and run it again?

(more…)

Capturing the Execution Plan

One last post on execution plans and Profiler (at least for now)

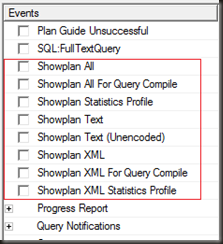
When trying to check a query’s execution plan, the display execution plan option of Management Studio is usually adequate, however there are occasions where it’s either not feasible to run the query from Management Studio or the particular behaviour can’t be reproduced in Management Studio (perhaps because of different SET options). For cases like this it may be necessary to capture the execution plans via SQL Trace. Fortunately there are events for execution plans. Eight of them, to be precise, all under the Performance folder.

PlanEvents

Great, so there’s no shortage of options available. But what are the differences between them?

Showplan All

According to Books Online:

The Showplan All event class occurs when Microsoft SQL Server executes an SQL statement. Include this event class to identify the Showplan operators on Microsoft SQL Server 2000 or Microsoft SQL Server 7.0. This event class will also work on SQL Server 2005 and later; however, the information included is a subset of the information available in the Showplan XML Statistics Profile or Showplan XML event class.

So in other words this one is not generally the event that we should be looking at on the latest versions of SQL. It’s not deprecated however (at least not in SQL 2008), so it is still usable on the later versions if you absolutely want.

Showplan

(more…)

Do IF statements cause recompiles?

I heard this one over at SSC a while back. “Avoid IF statements in stored procedures as they result in recompiles”

Ok, it sounds reasonable, if the optimiser optimises for the execution path taken on first execution it’ll have to go back and optimise the other paths when they are executed.

But is that really how it works? Now that I’ve spend some time looking at how the cache monitoring trace events behave, it’s possible to find out using those.

Let’s start with a simple example

CREATE TABLE Tbl1 (
  ID INT
);

CREATE TABLE Tbl2 (
  ID VARCHAR(10),
  SomeDate DATETIME
);
GO

CREATE PROCEDURE TestingRecompiles (@SomeParam INT)
AS
IF (@SomeParam = 1)
  SELECT ID FROM Tbl1;
ELSE
  SELECT SomeDate FROM Tbl2;
GO

Simple enough. First execution will be with the parameter value of 1. I’m going to use Profiler to see what’s happening. Events traced are SP:CacheInsert, T-SQL:StmtRecompile and the XML Plan for query compile, so I can see exactly what plan was generated. I’m using the ‘For Query Compile’ event so that I can catch the plan at optimisation time, not at execution time.

TraceEvents

(more…)

Recompiles

I’ve looked at cache hit and miss events and at the cache insert and remove events. The only cache-monitoring event (of current interest) left is the recompile event.

There are two recompile events available in Profiler in SQL 2008

  • SP:Recompile under Stored Procedures
  • SQL:StmtRecompile under T-SQL

Which to use when?

Books Online has the following to say on the two events.

The SQL:StmtRecompile event class indicates statement-level recompilations caused by all types of batches: stored procedures, triggers, ad hoc batches, and queries. Starting in SQL Server 2005, the SQL:StmtRecompile event class should be used instead of the SP:Recompile event class.

and

The SP:Recompile event class indicates that a stored procedure, trigger, or user-defined function has been recompiled. In SQL Server 2005 and later, recompilations reported by this event class occur at the statement level, whereas those in SQL Server 2000 occurred at the batch level.

In SQL Server 2005 and later, the preferred way to trace statement-level recompilations is to use the SQL:StmtRecompile event class. Starting in SQL Server 2005, the SP:Recompile event class is deprecated.

So it appears that they show the same thing and SP:Recompile is deprecated. That simplifies the entire situation, the only one that I’m going to look at in that case is the SQL:StmtRecompile event.

So what does the event look like?

RecompileEvents

(more…)

Come and gone

Or “Plan cache monitoring – insert and remove

Previously I took a look at the CacheHit and CacheMiss events to see how they behave and how to identify what’s been searched for in the cache. in this follow up, I want to take a similar look at the CacheInsert and CacheRemove events, see when they fire and how to identify the objects that they relate to.

Again, a word of caution, these can be frequently occurring events on busy servers and so traces should be kept short and to a minimum of events and columns. That said, these should occur a lot less often than the CacheHit and CacheMiss events. If they are occurring very frequently it may indicate that the SQL Server is not reusing plans efficiently.

CacheInsert

The CacheInsert event fires after a CacheMiss. The search for a matching plan in the cache failed, firing a CacheMiss event. Since there’s no plan, the optimiser is invoked to generate one and then that plan is inserted into the plan cache before the Query Execution engine begins execution.

The event is fairly simple, though of course there are a few surprises (what in SQL doesn’t have?).

Exec FireCacheEvents
GO

SELECT ID, SomeDate, Status
FROM TestingCacheEvents
WHERE Status =  'C'

CacheInsert

(more…)

Hit and miss

Or “Monitoring plan cache usage

For people interested in the details of how SQL is using and reusing execution plans, there are some useful events in profiler for watching this in detail, under the Stored procedure group:

  • SP:CacheMiss
  • SP:CacheInsert
  • SP:CacheHit
  • SP:CacheRemove
  • SP:Recompile
  • SP:StmtRecompile

Additionally there’s the SQL:StmtRecompile event under the TSQL group.

For now, I just want to look briefly at the CacheMiss and CacheHit events.

One word of caution early on, these are frequently occurring events and it may not be a good idea to trace these on busy production servers. If you do need to, keep the duration of the trace short and the columns to a minimum.

CacheEvents

CacheMiss

The cache miss event fires any time SQL looks for the execution plans for an object or ad-hoc batch and does not find it in the plan cache.

For an object (scalar function, multi-statement table-valued function, stored procedure or trigger) the match is done on the object ID (along with some of the connection’s SET options and possibly the database user and c couple other factors1). For an ad-hoc batch, the match is done on a hash of the text of the batch (along with some of the connection’s SET options and possibly the database user)

When testing stored procedures from Management Studio (or another SQL querying tool), two CacheMiss events will appear in the trace.

CacheMiss

What’s going on here?

(more…)

Are trivial plans cached?

It is sometimes said that trivial execution plans are not cached and queries that have such plans are compiled on every execution. So is that true? To effectively answer this question, we must first establish what a trivial plan is.

A trivial plan is essentially a plan for a query where a specific plan will always be the most optimal way of executing it. If we consider something like SELECT * FROM SomeTable then there’s only one real way to execute it, a scan of the cluster/heap.

The trivial plan is somewhat of a query optimiser optimisation. If the query qualifies for a trivial plan (and there are lots of restrictions) then the full optimisation process doesn’t need to be started and so the query’s execution plan can be generated quicker and with less overhead. The fact that a query has a trivial plan at one point doesn’t necessarily mean that it will always have a trivial plan, indexes may be added that make the selection of plan less of a sure thing and so the query must go for full optimisation, rather than getting a trivial plan

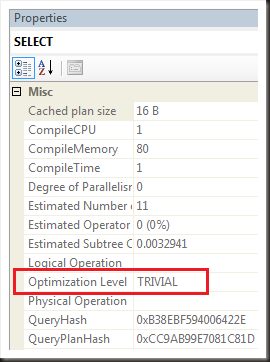
Nice theory, but how does one tell if a particular query has a trivial execution plan? The information is found within the execution plan, the properties of the highest-level operator has an entry ‘Optimisation level’ For a trivial plan this will read ‘TRIVIAL’

Trivial plan

(more…)

Estimated rows, actual rows and execution count

It’s often said that a major discrepancy between estimated and actual row counts in a query’s execution plan is a sign of inaccurate statistics or a poor cardinality estimate and that it’s a sign of a problem. This is generally true, however there are places where the estimates and actual rows will differ, often quite dramatically, without it been a problem. The reason for this is that these two values show slightly different things.

Let’s take a look at an example. (table creation code at the end of the post)

select bt.id, bt.SomeColumn, st.SomeArbDate
from dbo.BigTable bt
inner join dbo.SmallerTable st on bt.SomeColumn = st.LookupColumn
where bt.id between 5000 and 5100

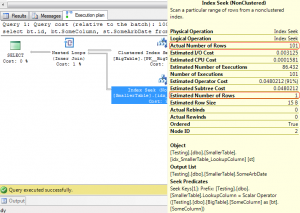
Estimated Actual discrepency

Estimated rows = 1, actual rows = 101. That’s a large discrepancy, but what caused it? It’s not out of date statistics (a usual cause) because the table has only just been created, so why is the estimation so far from the actual.

(more…)

Estimated and Actual execution plan revisited

After an interesting discussion on SQLServerCentral last week, I realised that the terms ‘estimated execution plan’ and ‘actual execution plan’ are perhaps a little bit misleading.

The only thing estimated about the estimated execution plan is the rowcounts, costs and row size. The plan itself isn’t an estimate. It’s not as if the optimiser, when asked for an estimated plan, does a less thorough job than when asked to compile a plan for a query’s execution.

The two forms of execution plan are better described as ‘execution plan with run-time information’ and ‘execution plan without run-time information’

When, in Management Studio, someone clicks the ‘display estimated execution plan’ button, the query is submitted to SQL Server, parsed and bound, algebratised and optimised just as if it was going to be executed. But the query is not executed, and as such, the plan when returned contains no run time information.

If there is a matching cached query plan, that cached plan is what’s returned and no optimisation is done. This can be seen by using profiler with the Cache hit, cache miss and cache insert events being traced.

When, in Management Studio, the query is run with the execution plan option enabled, the query is submitted to SQL Server, parsed and bound, algebratised, optimised and executed. The returned plan does contain the run-time for that specific execution, hence the plan contains things like ‘actual row count, actual IO cost’, etc

If there’s a matching query plan in cache then that cached plan will be used for the query’s execution and will be the one returned, though with the run-time information added

When a plan is cached, only the compile-time information is cached. The detailed run-time information on the actual number of rows and actual executions is discarded after updating the aggregated query stats. Hence, when you retrieve a query from the plan cache, it will not contain the run-time information. Consider a plan that’s been used 20 times. Which execution’s run-time information would it contain? Remember that there’s only one plan in cache per procedure.

Hence, a plan fetched from cache will be identical to the plan returned by requesting the estimated execution plan for a specific query (Providing there’s nothing happening to invalidate the cached plan)

Profiler can capture (depending on event) the plan without the run-time information or the plan with the run-time information. There’s a nice table in chapter 2 of one of Itzik’s books that shows the various profiler events, when they fire and what they return.

A Bookmark lookup, by any other name…

I think I may have confused some people by talking about bookmark lookups. I’ll attempt to clarify things.

The operator that I’m talking about is the one that fetches extra columns from the clustered index when the nonclustered index that’s used to retrieve the rows doesn’t have all of the columns required.

In SQL 2000, that operator appeared in the execution plan as a bookmark lookup and it appeared as follows:

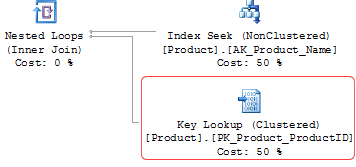
In SQL 2005, the name was changed, and the bookmark lookup no longer appeared in the execution plan. In it’s place appeared a clustered index seek, joined back to the original index seek by a nested loop join. It appeared as follows (the highlighted operator is the ‘bookmark lookup’)

This change made it harder to see what was going on as clustered index seeks are usually considered ‘good’. The trick to see if it is actually a ‘bookmark lookup’ is to look at the objects involved. When the nonclustered index seek and the clustered index seek are both on the same table, then it’s a ‘bookmark lookup’

I don’t recall what this appeared as when the base table was a heap, not a cluster.

In SQL 2005 SP2, the name of the operator was changed again, now appearing as a key lookup (when the base table has a clustered index) or a RID lookup (when the base table is a heap). It now looks like this:

The thing to note is that it’s not the version of the server that’s important. The format of the XML for the exec plan has not changed since SQL 2005 RTM (I can and have created a .sqlplan file from SQL 2008 and opened that file in SQL 2005’s management studio).

It’s the version of management studio that affects how the execution plans are displayed. If the server is SQL 2005 SP3, but the client tools are still RTM, the bookmark lookup will appear as a clustered index seek. Another reason to patch the client as well as the server

I hope that clears up some of the confusion around the naming. So, in future, what should I refer to this as? A bookmark lookup? A Key lookup?