Execution Plans

Execution plan – more properties

I ran across a few more properties visible in the exec plan that I thought would be useful to people. So, without further ado…

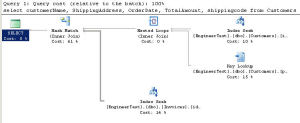
Some overall properties of the entire execution can be seen by selecting the highest-level operator in the plan (the one on the left-most, typically the select, insert, update or delete operator) and then opening the properties window

The first four items, the compild plan size, compile CPU, compile Time and compile Memory all refer to the optimisation process that the query went through. They indicate how much in the way of server resources was spent compiling this query and how large the cached plan is in memory.

This can be important when dealing with queries that recompile often or are very seldom reused

(more…)

An example exec plan

Back to the technical posts…

I’m going to take an example of a very simple execution plan that I used in a presentation a few weeks back and go over it in some detail, pointing out information that is available and what can be read from the plan.

The execution plan can be downloaded (in xml format) here – ExecPlanDem01.zip

The query that the plan came from is a very simple two table query. It’s not a very optimal plan, but that’s because I forced an index hint in order to generate a more interesting plan. Without the hint, it’s a simple exec plan with two index seeks and a nested loop join.

Overview

The first thing that can be seen from the execution plan is that most of the cost of the query is in two operations, a key lookup (formerly called a bookmark lookup) and a clustered index seek. The high cost of the key lookup is a good sign that the query is using an inappropriate index. (in a future post I’ll discuss using the exec plan to choose indexes)

(more…)

Execution plans – important properties

Time I wrote another piece on execution plans (see the first post for the full list)

So, now a quick look at some of the important properties of exec plan operators.

  • Estimated number of rows – This is the number of rows that the query optimiser estimates this operator will process. The estimate is based on the statistics and on other data available at time of compilation. It’s possible that this number includes a fraction, due to the way to optimiser does its estimates
  • Actual number of rows – This is the actual number of rows that were processed by the operator. This value is calculated by the query processor at execution time. An estimated execution plan will not include this. (more…)

Execution plan operations – misc

This is going to be the last post on the operators in an execution plan. I’m not going to cover all the other operators. There are a lot of operators, many quite specialised or only appearing in specific scenarios. Conor Cunningham’s writing a series covering the deep, dark details of some of the operations

So onto the operators. I’m going to cover Sort, Concatenate and Scalar Function.

Sort

Sort has three logical operators:

  • Sort
  • Distinct Sort
  • Top-N Sort

Sort is used to satisfy any ORDER BY that is specified in a query, if the index used does not naturally sort the rows in the desired way. It also may appear in the execution plan before a merge join or a stream aggregate. Sometimes SQL may decide that a sort followed by a merge join or stream aggregate is cheaper than a hash join or hash aggregate.

Distinct sort is used for DISTINCT, sometimes for UNION and sometimes for GROUP BY where no aggregates are specified.

(more…)

Execution plan operations – aggregates

On to aggregates.

I’m not going to dwell too long on the logical operators for aggregates, as they aren’t as interesting as the joins were. Rather I’m going to concentrate on the physical operators involved.

The two physical operators used for aggregates (and a couple of other logical operations) are:

  • Stream Aggregate
  • Hash Aggregate

Stream Aggregate

The stream aggregate is the faster and more efficient of the aggregate operators. For it to be used, the input rowset must be sorted in order of the grouping columns.

(more…)

Execution plan operations – joins

It’s about time I picked this series up again.

I’m not going to go into too much detail on joins. There are some very good articles elsewhere on joins. The important thing to notice about joins, in the context of an execution plan, is that there are six logical join operators and three physical join operators. The logical operators are what you ask for in the context of the query, the physical operators are what the optimiser picks to do the join.

The six logical operators are:

  • Inner Join
  • Outer Join
  • Cross Join
  • Cross Apply (new in SQL 2005)
  • Semi-Join
  • Anti Semi-Join

Craig Freedman wrote a long article on the logical join operators – Introduction to Joins

The semi-joins are the exception, in that they cannot be specified in a query. Nonetheless, they are present in disguise. They’re the logical operators for EXISTS, IN, NOT EXISTS and NOT IN. They’re used when matching is required, but not a complete join.

(more…)

Execution plan operations – scans and seeks

Another post in my ongoing series on reading execution plans. I know I’m jumping around a bit. I hope it makes some kind of sense.

I thought I’d quickly go over the seek and scan operations that can be seen in execution plans. There are 6 main ones. There’s a fair bit that I’m glossing over in this. I’ll get into some details at a later date.

Scans

  • Table scan. This operation only appears for a heap (table without a clustered index). The first page in the heap is located based on info in the system tables, and then the pages are read one by one, using the next and, if necessary, previous pointers in the page headers. This is generally an expensive operation and should be avoided where ever possible
  • (more…)

Execution plans from Profiler

There is another way to get hold of query execution plans than through query analyser/management studio. In SQL 2005, Profiler has a large number of plan-related events. It had some in SQL 2000, but they were quite hard to work with.

The interesting ones in SQL 2005 are as follows, all found under the performance collection in profiler.

  • Showplan XML
  • Showplan XML for query compile
  • Showplan XML Statistics Profile

As soon as one of these is selected, a third tab appears on the trace setup screen, asking for the file to save the xml plans. You can choose to save the plans within the profiler trace file, however the file tends to get very, very large when that is done.

TheĀ  Showplan XML for query compile event fires every time a query is compiled, and it produces an estimated execution plan.

The showplan XML event fires every time a query runs, and it produces an estimated execution plan. When I tested it, it looked as though it was the actual plan, however all the run-time information (actual rows affected, etc) were 0

The Showplan XML statistics profile event fires every time a query runs and produces an actual query plan, with the run-time information in it.

Be careful when running profiler with these events on a busy system as they are quite large, and you can end up with very large output files very quickly. Also, on a busy server they can be very frequent events and capturing them with the profiler front end could result in performance degradation.

Execution plans, estimated vs actual

This is the second post on execution plans. I’m going to briefly discuss estimated execution plans and actual execution plans, the differences between them and when you would want to use which.

First however, a bit on query execution, just so that I know everyone’s on the same page.

When a query is submitted to SQL Server (and for simplicity I’m going to assume it’s a straight select statement not a procedure) the query is parsed, then bound to the underlying objects(tables, views, functions, etc). Once the binding is complete, the query passes to the query optimiser. The optimiser produces one or more suitable execution plans for the query (more on that in a later post). The query is then passed into the query execution engine, which does the memory grants, picks a parallelism option, if necessary and executes the various query operations.

Estimated execution plans

When an estimated execution plan is requested for a query, the query goes through the parsing, binding and optimisation phases, but does not get executed.

(more…)